Gas Fireplace Cleaning San Diego
It can get cool in the winter or evening in San Diego, California.
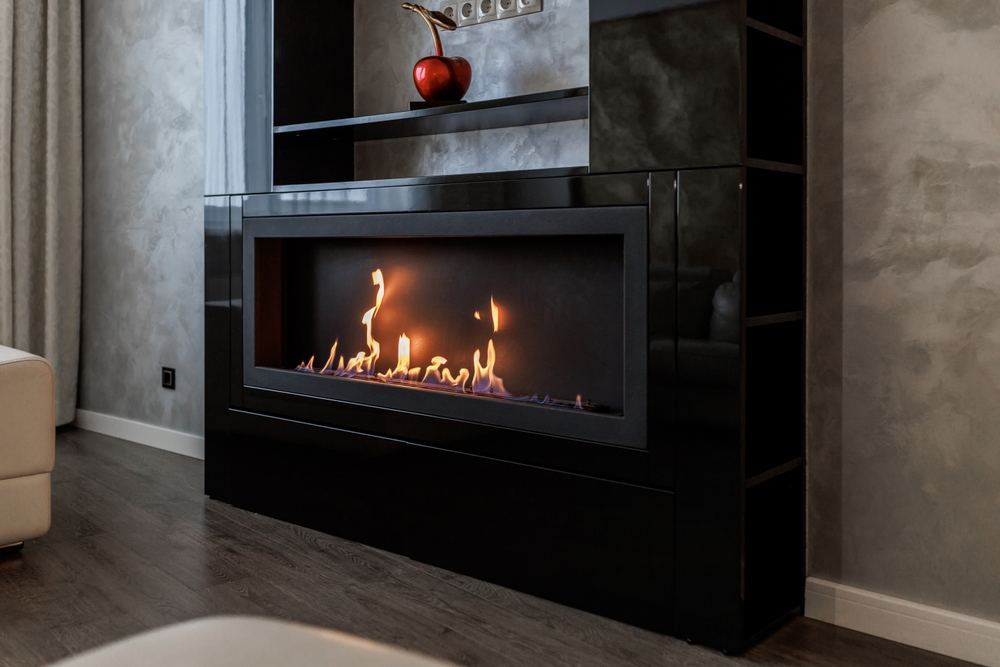
Did you know that your gas fireplace needs to be serviced every year to ensure safe operation?
If you are like most people you were unaware of this necessity.
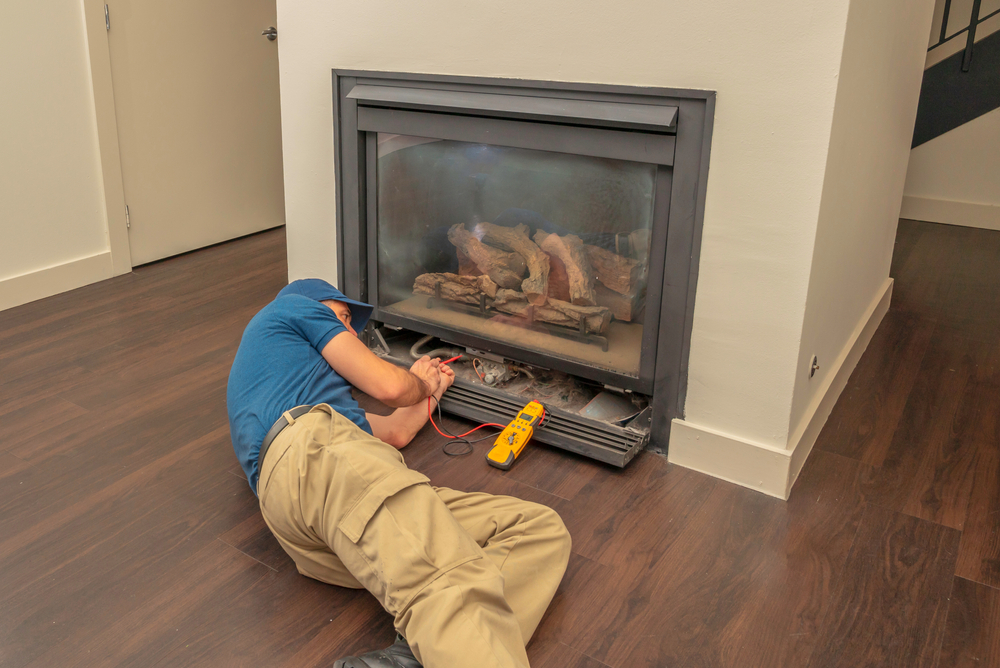
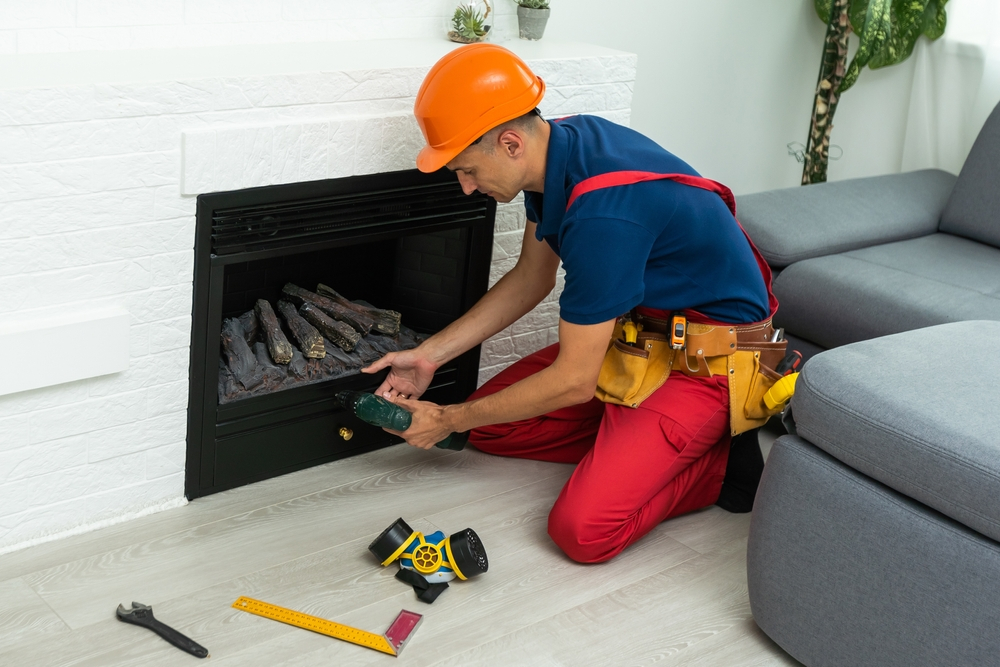
It is recommended that a licensed service technician inspects your gas fireplace annually to ensure the safe, efficient, and reliable operation of your gas unit.
For the safety of your home, it is recommended that both gas fireplaces and wood-burning fireplaces including stove inserts and pellet stoves be serviced once a year. Any time you have a live-fire burning in your home you want to make sure everything is performing at optimal efficiency for safety and reliability.
Another thing to consider is that there is a higher risk of having a carbon monoxide issue due to parts wearing out if you do not get your fireplace inspected by a professional every year.
There are a lot of moving parts in gas fireplaces. Servicing those parts to make sure they have been adjusted appropriately and identifying when they need to be replaced will give you peace of mind when using your appliance. Those parts last longer when they are serviced on an annual basis saving you money in the long run.
If you don’t use your gas unit often there is a possibility of bugs and spiders in the venting living and spinning webs. This can cause issues with proper venting and can also be a factor in causing a carbon monoxide issue.
So even though gas fireplaces don’t cause creosote build up like in a wood-burning fireplace there can still be issues with parts needing to be replaced or adjusted. A yearly inspection is the best solution to keeping your family safe from carbon monoxide leaks due to unexpected failure of worn-out parts.
We offer gas fireplace repair and cleaning. Chimcare started years ago as a family-based business. Since then we have grown from one chimney sweep to a crew of licensed technicians offering you home solutions from fireplace inspection, cleaning, installation, and other related services.
Simply call to schedule an inspection in San Diego for gas fireplace cleaning which will include the safety inspection. This service will give you peace of mind, save you money, and could save your life.
Facts about San Diego
| Jan | Feb | Mar | Apr | May | Jun | |
|---|---|---|---|---|---|---|
| Average high in ºF | 65 | 76 | 73 | 69 | 76 | 75 |
| Average low in ºF | 48 | 65 | 61 | 54 | 67 | 65 |
| Days with precipitation | 6 | 1 | 3 | 4 | 0 | 0 |
| Hours of sunshine | 217 | 255 | 234 | 236 | 277 | 293 |
| Av. precipitation in inch | 1.53 | 0.15 | 0.57 | 1.01 | 0.02 | 0.03 |
| Jul | Aug | Sep | Oct | Nov | Dec | |
|---|---|---|---|---|---|---|
| Average high in ºF | 71 | 69 | 67 | 66 | 65 | 65 |
| Average low in ºF | 62 | 59 | 56 | 53 | 51 | 49 |
| Days with precipitation | 1 | 2 | 5 | 7 | 7 | 7 |
| Hours of sunshine | 253 | 261 | 242 | 262 | 212 | 216 |
| Av. precipitation in inch | 0.07 | 0.12 | 0.78 | 1.81 | 2.27 | 1.98 |
Source: https://www.usclimatedata.com/climate/san-diego/california/united-states/usca0982
The city had a population of 1,307,402 according to the 2010 census, distributed over a land area of 372.1 square miles (963.7 km2).[106] The urban area of San Diego extends beyond the administrative city limits and had a total population of 2,956,746, making it the third-largest urban area in the state, after that of the Los Angeles metropolitan area and San Francisco metropolitan area. They, along with the Riverside–San Bernardino, form those metropolitan areas in California larger than the San Diego metropolitan area, which had a total population of 3,095,313 at the 2010 census.
The 2010 population represents an increase of just under 7% from the 1,223,400 people, 450,691 households, and 271,315 families reported in 2000.[103] The estimated city population in 2009 was 1,306,300. The population density was 3,771.9 inhabitants per square mile (1,456.3/km2). The racial makeup of San Diego was 58.9% White, 6.7% African American, 0.6% Native American, 15.9% Asian (5.9% Filipino, 2.7% Chinese, 2.5% Vietnamese, 1.3% Indian, 1.0% Korean, 0.7% Japanese, 0.4% Laotian, 0.3% Cambodian, 0.1% Thai). 0.5% Pacific Islander (0.2% Guamanian, 0.1% Samoan, 0.1% Native Hawaiian), 12.3% from other races, and 5.1% from two or more races. The ethnic makeup of the city was 28.8% Hispanic or Latino (of any race);[103][107] 24.9% of the total population were Mexican American, 1.4% were Spanish American and 0.6% were Puerto Rican. Median age of Hispanics was 27.5 years, compared to 35.1 years overall and 41.6 years among non-Hispanic whites; Hispanics were the largest group in all ages under 18, and non-Hispanic whites constituted 63.1% of population 55 and older.
A U.S. Navy vice admiral and an intelligence specialist celebrating Hispanic American Heritage Month in San Diego
As of January 2019, the San Diego City and County had the fifth-largest homeless population among major cities in the United States, with 8102 persons experiencing homelessness.[108] In the city of San Diego, 4887 individuals were experiencing homelessness according to the 2020 count.[109]
In 2000 there were 451,126 households, out of which 30.2% had children under the age of 18 living with them, 44.6% were married couples living together, 11.4% had a female householder with no husband present, and 39.8% were non-families. Households made up of individuals account for 28.0%, and 7.4% had someone living alone who was 65 years of age or older. The average household size was 2.61, and the average family size was 3.30.
The U.S. Census Bureau reported that in 2000, 24.0% of San Diego residents were under 18, and 10.5% were 65 and over.[103] As of 2011 the median age was 35.6; more than a quarter of residents were under age 20 and 11% were over age 65.[110] Millennials (ages 18 through 34) constitute 27.1% of San Diego’s population, the second-highest percentage in a major U.S. city.[111] The San Diego County regional planning agency, SANDAG, provides tables and graphs breaking down the city population into five-year age groups.[112]
In 2000, the median income for a household in the city was $45,733, and the median income for a family was $53,060. Males had a median income of $36,984 versus $31,076 for females. The per capita income for the city was $35,199.[113] According to Forbes in 2005, San Diego was the fifth wealthiest U.S. city,[114] but about 10.6% of families and 14.6% of the population were below the poverty line, including 20.0% of those under age 18 and 7.6% of those age 65 or over.[113] San Diego was rated the fifth-best place to live in the United States in 2006 by Money magazine,[115] although it was no longer rated in the top 100 places by 2017.[116] As of January 1, 2008 estimates by the San Diego Association of Governments revealed that the household median income for San Diego rose to $66,715, up from $45,733 in 2000.[117]
San Diego was named the ninth-most LGBT-friendly city in the U.S. in 2013.[118] The city also has the seventh-highest percentage of gay residents in the U.S. Additionally in 2013, San Diego State University (SDSU), one of the city’s prominent universities, was named one of the top LGBT-friendly campuses in the nation.[119]
According to a 2014 study by the Pew Research Center, 68% of the population of the city identified themselves as Christians, with 32% professing attendance at a variety of churches that could be considered Protestant, and 32% professing Roman Catholic beliefs.[120][121] while 27% claim no religious affiliation. The same study says that other religions (including Judaism, Buddhism, Islam, and Hinduism) collectively make up about 5% of the population.
Source: https://en.wikipedia.org/wiki/San_Diego#Demographics
Gas Fireplace FAQs – San Diego, California
How often should I schedule a professional fireplace inspection in San Diego?
Despite our mild climate, San Diego experts recommend an annual inspection and cleaning—even for gas fireplaces—to check for blockages, flue integrity, and compliance with NFPA 211 standards.
What levels of chimney inspection are available?
NFPA 211 defines three levels: Level 1 is annual visual; Level 2 uses video cameras after fuel changes or real estate transactions; and Level 3 is invasive, used when issues can’t be identified visually.
Can I still use the fireplace during wet winter months?
Yes—but be aware moisture can degrade burner components and gas valves. Schedule a post-winter inspection to clean off corrosion and ensure safe operation. ()
Where must I install carbon-monoxide detectors?
California law requires CO alarms outside each sleeping area and on every level if you have a gas fireplace or attached garage. They must be certified (e.g., UL or ANSI) and replaced every 7 years.
What should I do if I smell strange odors near my fireplace?
Mild “burnt” smells on first use are normal, but persistent chemical or rotten-egg odors may indicate gas or CO leaks—stop using it, ventilate the area, and call a certified technician immediately.

 >
>
Leave a Reply